

Latest Weather Blog
Santa and the Arctic
For those planning a destination holiday or dreaming of a White Christmas, few times in the year bring more curiosity in the long-term forecast than now. While reliability remains low at the two-week mark, as of December 12, numerical weather prediction offers something a bit more tangible than just “above” or “below” average.
Numerical weather prediction (NWP) data are the form of weather model data we are most familiar with on a day-to-day basis. NWP focuses on taking current observations of weather and processing these data with computer models to forecast the future state of weather. NWP along with assessments of current, global climate patterns and historical averages are forecasters’ best tools to examine weather beyond a three or four day timeframe.
The first place to begin long-term forecast is with history. What is average weather for the time in question? In Baton Rouge, for December 25, a normal high temperature is 63 and a normal low temperature is 42. In 87 years of data at Metro Airport, there has been precipitation 28 percent of the time. A trace of snow was recorded in 1953 and 2004.
Trending News
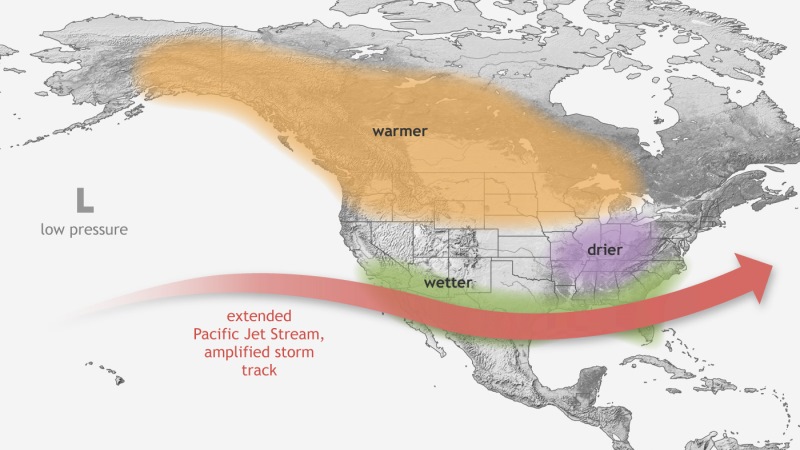
Global climate patterns offer some idea as to how the weather may work out relative to those averages. The well-known indicator, ENSO or El Nino Southern Oscillation is neutral, but trending positive. In other words, an El Nino is expected to develop deeper into the winter. For the local area, that tends to dictate a wetter than usual pattern with more episodes of severe weather. More tornadoes have occurred in the Baton Rouge area during El Nino winters than La Nina winters.
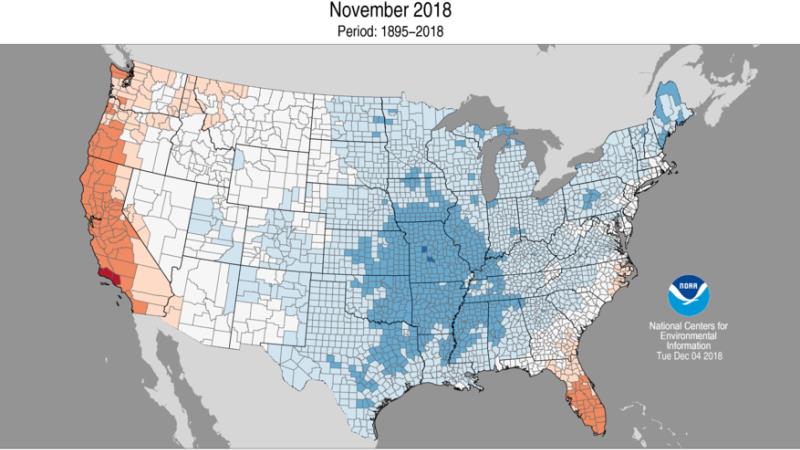
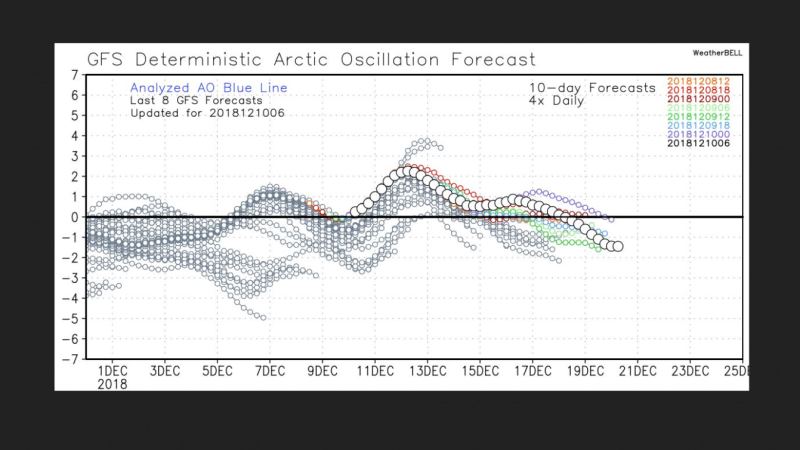
Another important climate pattern in the cold months is the Artic Oscillation (AO). The AO is a climate pattern characterized by winds circulating counterclockwise around the Arctic. In positive phase, a ring of strong winds circulating around the North Pole acts to confine colder air across polar regions. When the AO goes negative, this belt of winds becomes weaker and more distorted, allows an easier southward penetration of colder air (and perhaps Santa Claus) and increased storminess into the United States. While the AO was negative in November leading to below average temperatures, it has trended a bit more neutral into December. There are some signs of a positive phase in the middle of the month and then back toward neutral for the end of the month.
Finally, there is the NWP. Both the American and European long-range forecast models show temperatures near or slightly above average for the end of December. However, these models represent only one run of a model. Especially for longer term forecasts, ensemble models become more useful. Ensembles provide an average of dozens of model runs to account for the wide array of potentially changing variables. Ensembles show near or slightly below average temperatures for the end of December.
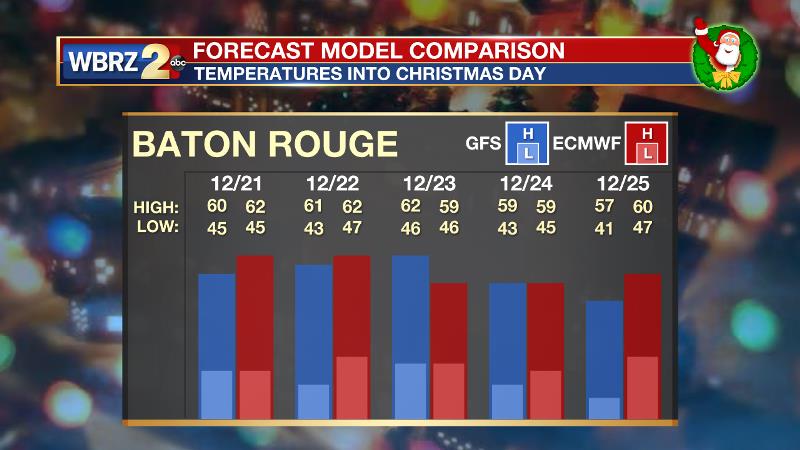
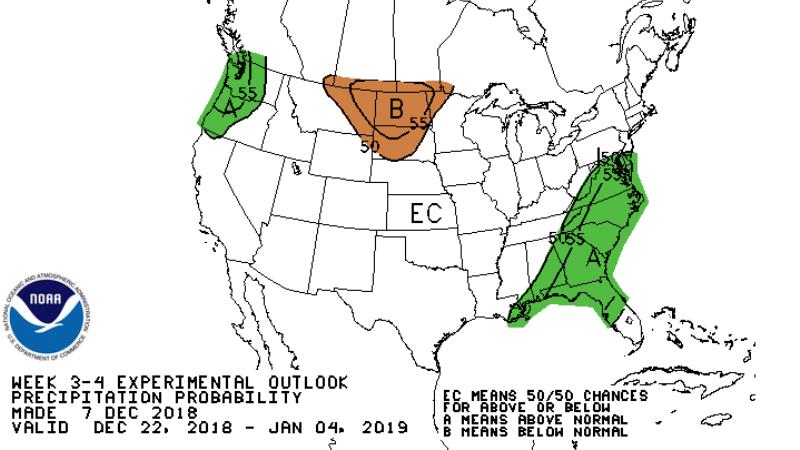
So, which way will Santa’s cookies crumble? To answer that, at this stage, we will look at the probabilities. Since we are moving toward an El Nino pattern chances for precipitation are higher than the historical average of 28 percent. A neutral to negative AO and guidance from NWP points to high temperatures near 60 and low temperatures near 40. For what it is worth, the Climate Prediction Center is pointing to near average temperatures and slightly better than average chances for precipitation.
The WBRZ Weather Team is here for you, on every platform. Your weather updates can be found on News 2, wbrz.com, and the WBRZ WX App. on Apple and Android devices. Follow WBRZ Weather on Facebook and Twitter for even more weather updates while you are on the go.
More News
